Shiny application for dynamic exploration of multi-dimensional time series data to detect anomalies in power turbine generators
Abstract
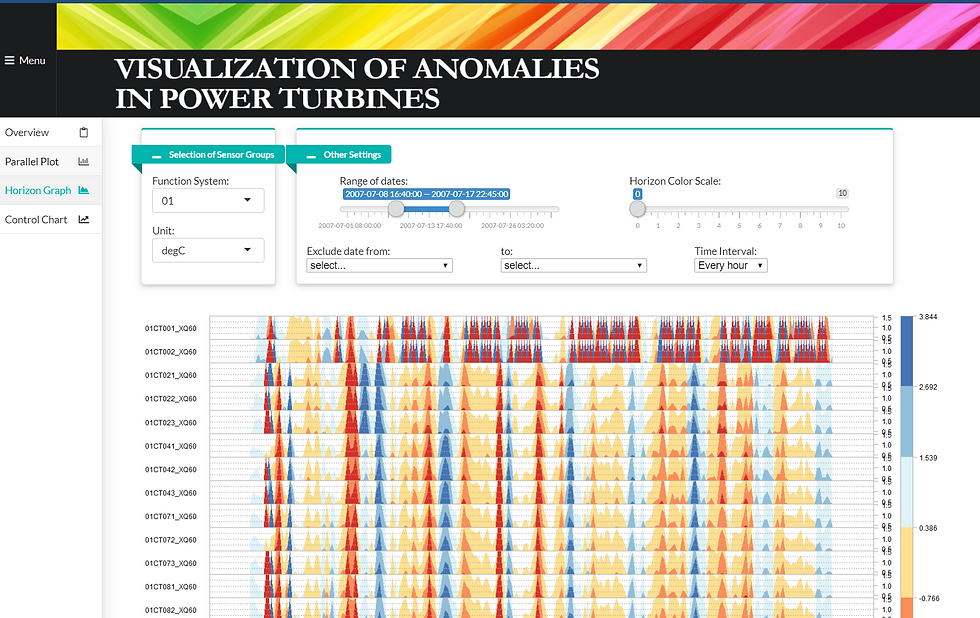
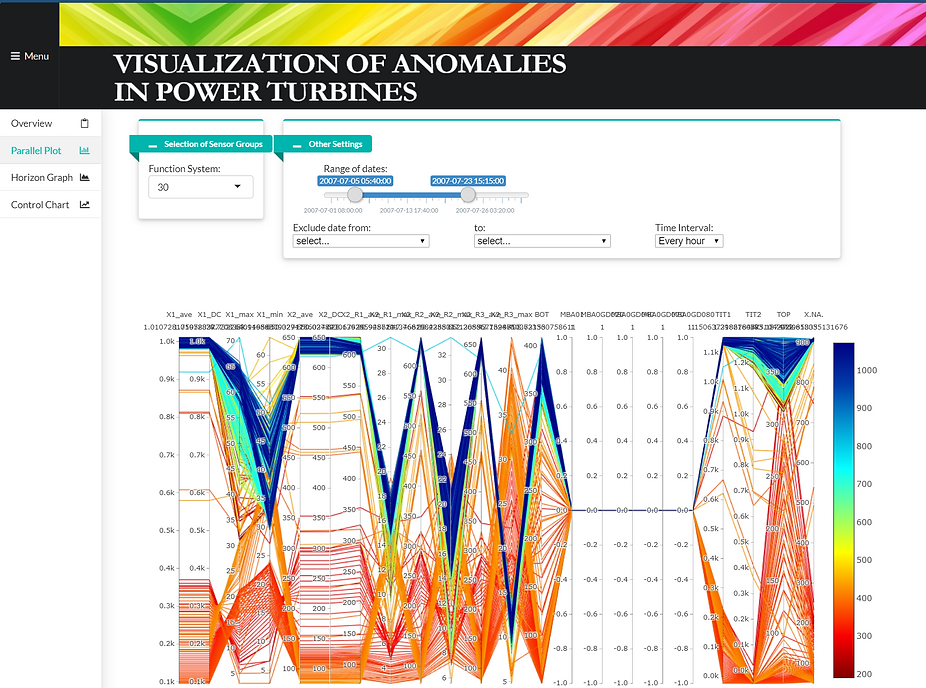
Anomaly detection for highly complex engineering systems such as power turbine generators can be challenging. Power turbine generator consists of multiple sub-systems where underlying key components are required to be measured by a variety of sensors for parameters such as temperature, pressure or rotational speed. The condition monitoring is a common method used to detect anomalies by imposing threshold limits for each sensor, however it is known to detect large number of false positive as well as false negative. The “health” of such complex system cannot be accurately assessed based on univariate analysis of individual sensor’s readings. These systems often vary in their running mode and may be subjected to different operating conditions. Moreover, given the large number of sensors (often of different dimensions), traditional means of monitoring such as Oracle Hyperion or Excel based Information Dashboard may either be unscalable or extremely time consuming to implement. The team has developed a Shiny application that aims to detect anomalies within a power turbine generator. Based on time series sensor data collected, the application uses a top down visualization approach utilizing parallel plot and horizon graph to gain holistic visualization of several sensors within a stipulated time frame to identify potential sensors of concern before drilling down to the individual sensor using control charts to visualize its measurement variations over time. The use of R and R Shiny enables quick deployment of the proposed anomaly detection application which can easily utilized even by personnel who are not well verse in statistical methods or coding.
Credits:
With collaboration with Kelvin Lum, Thia Wei Soon.